A solar-only surveillance platform runs on a single daily equation: the energy its panels capture has to equal or exceed the energy its cameras, communications, and lighting consume. Panel count and battery capacity set the ceiling on that equation. Solar panel positioning determines how much of that ceiling a given deployment actually reaches.
That distinction is where a lot of solar-only reliability is won or lost. Two identical platforms, with the same load and location, can return very different uptimes depending on how they are aimed, angled, and parked. One harvests enough to ride through the night and recover the next day. The other charges almost enough, then it starts borrowing against tomorrow’s battery. The hardware didn’t change. The setup did.
So the practical question isn’t whether solar works. It’s about whether a specific deployment can provide the sunlight access, panel angle, and field discipline needed to keep the batteries recovering in real conditions, day after day, through the season the mission actually runs.
Positioning is Part of the Power Strategy
Solar panel positioning sits at the intersection of energy production, battery recovery, and operational trust. Treated casually, a solar-only platform may run for a while — with thinner margin and more risk than the team realizes. Planned deliberately, the same platform has a far better chance of staying online through the life of the mission.
That’s the takeaway. Positioning isn’t about chasing perfect efficiency. It’s about protecting uptime. For off-grid surveillance, it’s one of the quiet disciplines that separates a platform that has solar panels from one that reliably stays online — and for teams evaluating mobile surveillance, that’s the distinction that matters: not whether the platform can generate solar power, but whether the deployment can sustain it.
The Four Variables that Decide Whether you Reach the Ceiling
Positioning comes down to four field variables: direction, tilt, shading, and season. None are abstract. Each one moves the daily energy harvest up or down.
1) Direction
Panels need their strongest exposure during the core charging hours around midday. In the Northern Hemisphere that means orienting the array toward true south, not magnetic south. Depending on where you deploy in North America, magnetic declination can put compass-south off from solar-south by 10 to 20 degrees, which is enough to shave usable production off both ends of the charging window. Aim by sun, not by needle.
2) Tilt
The sun’s height changes through the year, so the best fixed tilt angle does too. A workable baseline is to set tilt roughly equal to the site’s latitude, then bias from there: flatter than latitude (about latitude minus 15 degrees) captures the high summer sun, steeper than latitude (about latitude plus 15 degrees) catches the low winter sun. The steeper winter setting does double duty — it also helps snow slide off rather than sit on the array and blocking solar production. This is where setups quietly drift out of spec: an angle left at its summer setting will keep working into fall and winter, but at only a fraction of what the same panels could produce if they were retilted for the lower sun.
3) Shading
This is the most underestimated of the four, because partial shade costs far more than it looks like it should. Within each panel, the solar cells are wired in series, so output is limited by the weakest-lit cells in the string. A shadow falling across even a small part of the array — from the mast, a light pole, a parked vehicle, or a structure the platform was tucked beside for convenience — can cut that section’s contribution well beyond the fraction of surface it actually covers. Bypass diodes contain the damage, but they don’t erase it. And shadows move: a position that’s clear at deployment can be shaded across peak charging hours a few weeks later as the sun’s path shifts or nearby trees leaf out.
4) Season
Season ties the other three together. Day length, sun angle, and weather all move at once, and they move against you heading into winter. Peak sun hours shrink, solar irradiance drops as the sun sits lower, and snow stays on a too-shallow array longer. The same platform, in the same spot, with the same load, can produce a fraction of its summer energy in January — not because anything failed, but because the margin it was running on disappeared.
Why Summer Performance Hides Winter Solar Production Risk
The most common planning mistake is reading summer reliability as proof that the deployment is sound. To see why that’s a trap, you have to look at how runtime actually behaves — because runtime doesn’t follow production. It follows the margin.
Runtime follows the margin, not the production
A solar-only platform lives on a daily cycle. From sunset to sunrise the panels produce nothing, so the battery carries the entire load — for this reference platform’s 100 W continuous draw, that’s roughly 1.2 kWh withdrawn every night. The next day, the panels have two jobs before anything else: run the daytime load and pay back what the battery loaned out overnight.
Add it up over a full 24 hours and the bookkeeping is simple: the load consumes 2.4 kWh per day, so the panels need to produce at least 2.4 kWh per day to break even. When they do, the battery dips overnight, refills by afternoon, and finishes every day where it started — full. That’s the margin, and it’s the only number runtime cares about. As long as daily production covers daily consumption, runtime is unlimited, whether the surplus is 0.1 kWh or 2 kWh. Extra production above the load line buys you nothing on a sunny day — by mid-afternoon, the battery is full, and the surplus has nowhere to go. Its real job is insurance: it’s what quickly refills the battery after a cloudy stretch, not slowly.
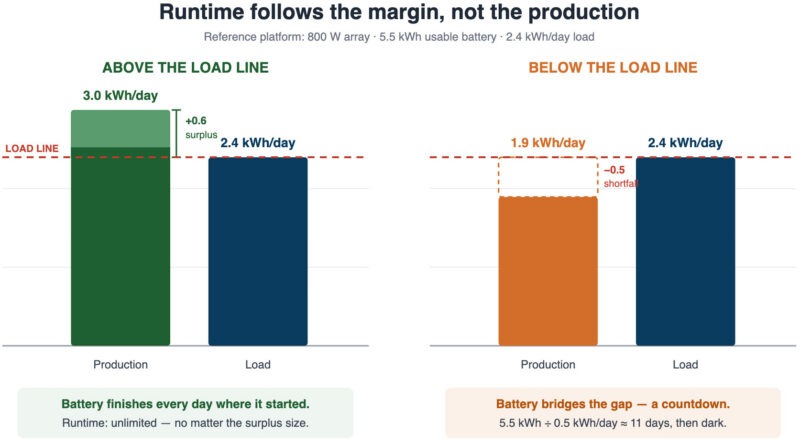
Below the line, the battery is a countdown
The moment production falls under the load, the battery starts bridging the gap, and runtime stops being a question of “if” and becomes simple arithmetic:
Runtime = usable battery ÷ daily shortfall
A shortfall of just half a kWh per day empties this platform’s 5.5 kWh bank in about 11 days. And nothing looks broken while it happens. The cameras stay up, the comms stay up, the dashboard shows charging every day — the panels are still producing, just not quite enough. There’s no event to notice. The battery’s state of charge just walks downhill until, one morning, it doesn’t come back.
That’s the cliff
Here’s the part that breaks intuition: a percentage decrease in production is not an equal decrease in runtime. Losing 30% of production in a month with plenty of margin costs nothing — you were above the load line before, and you’re above it after. Losing the same 30% in a month with a thin margin pushes production over the line, and runtime collapses from unlimited to days.
What matters isn’t how much energy positioning loses. It’s whether the loss pushes production across the load line.
Same setup, one month apart
Run the numbers for the reference platform at a northern site and the cliff stops being abstract:
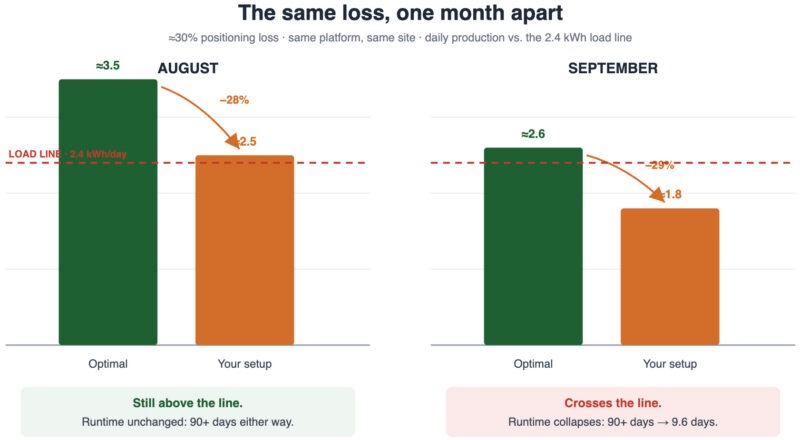
August.
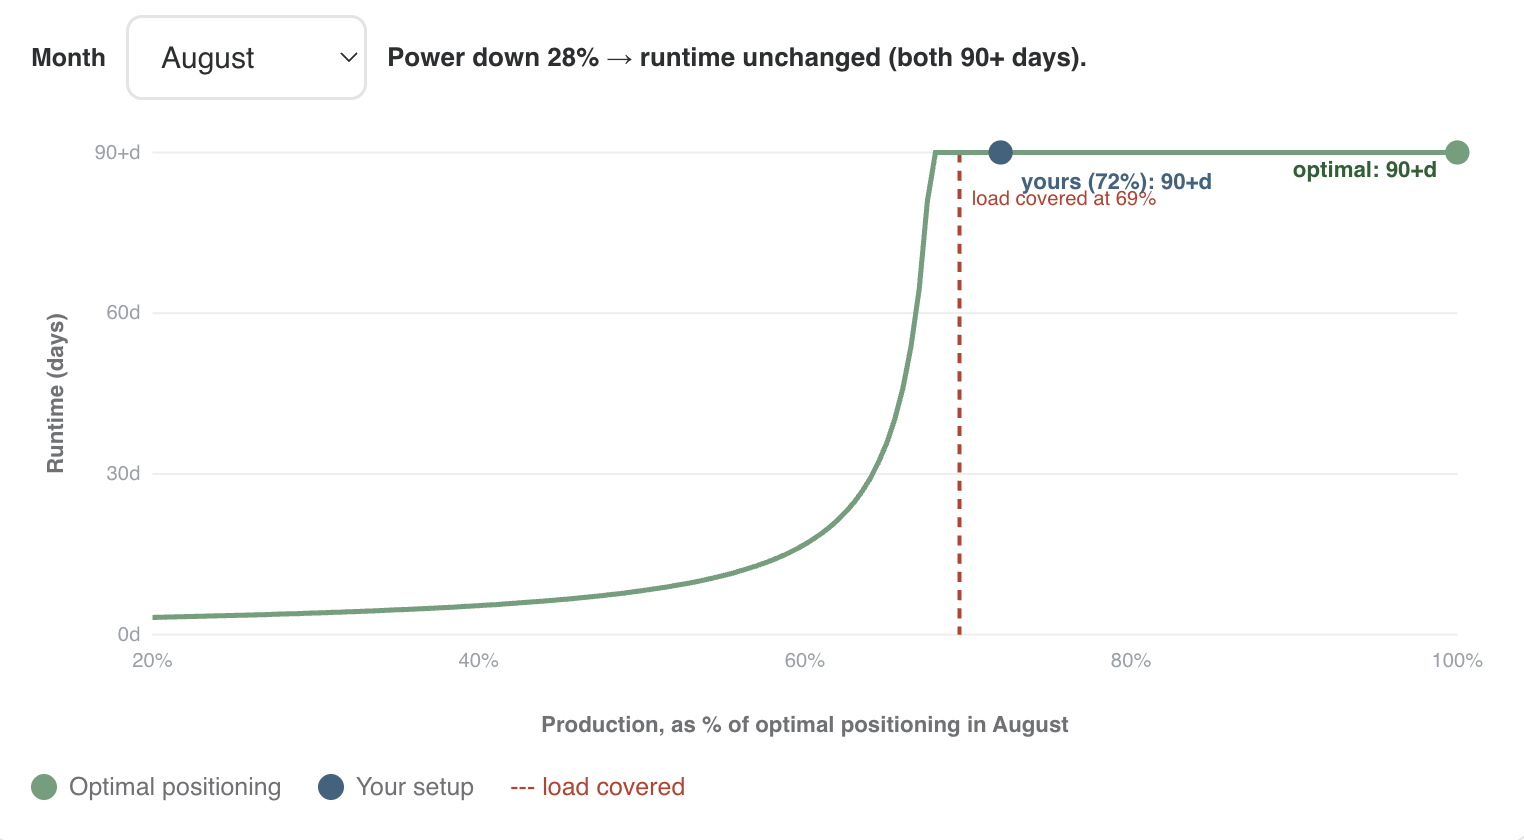
An ideally positioned array produces roughly 3.5 kWh/day — about 45% more than the 2.4 kWh load. The load is covered at just 69% of optimal production, so a degraded setup running at 72% of optimal still clears the line. Power down 28%, runtime unchanged: 90+ days either way. The sloppy setup looks identical to the dialed-in one.
September.
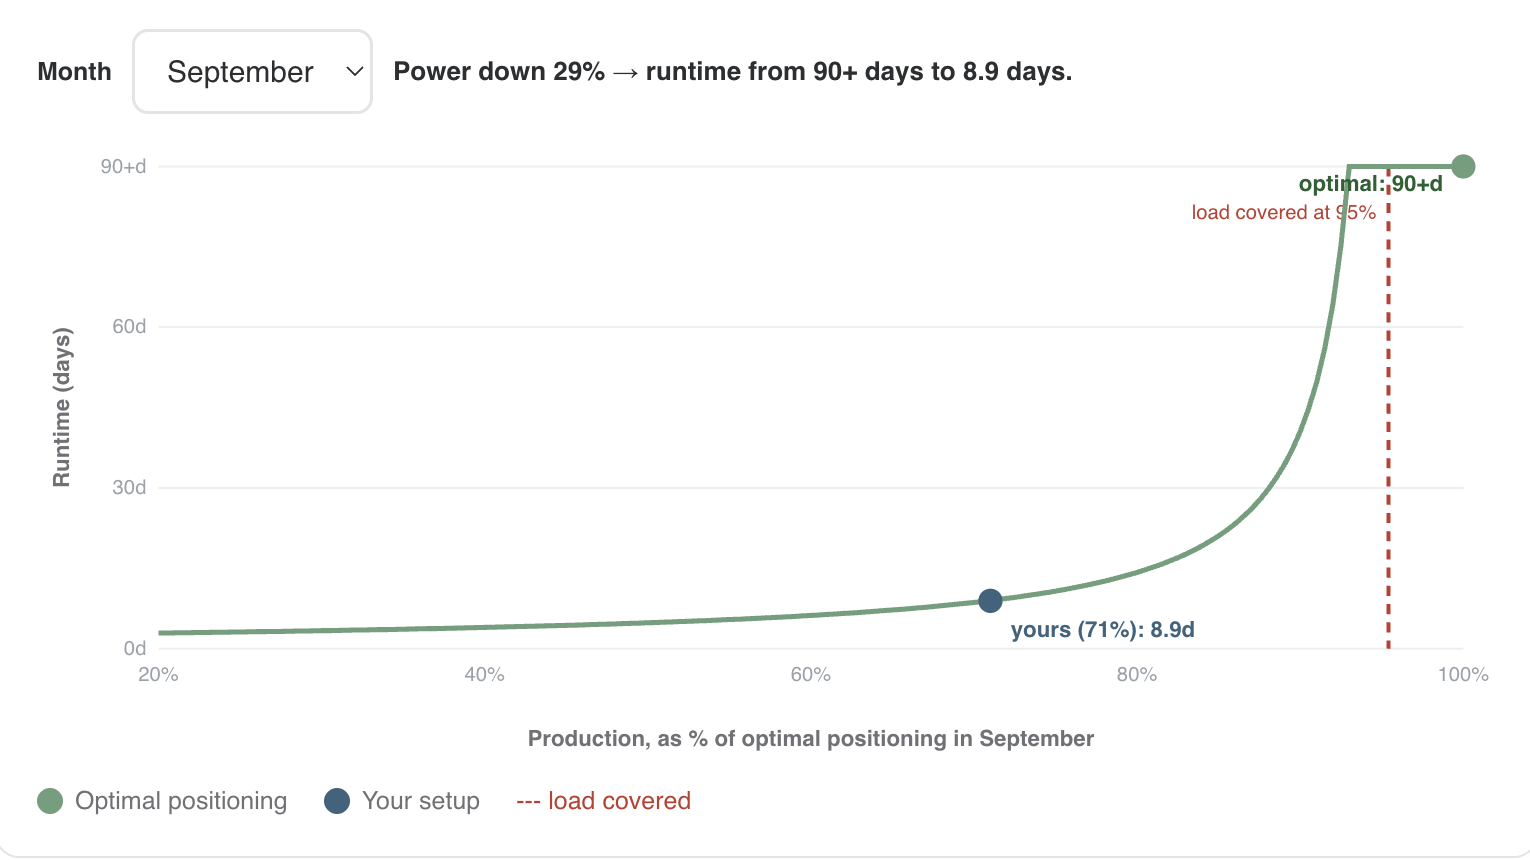
Same site, same hardware, thirty days later. Optimal production has slid to roughly 2.6 kWh/day, and the load now needs 93% of it. The headroom is gone. The same degraded setup — now 71% of optimal — lands well below the line. Power down 29%, runtime drops from 90+ days to 9.6 days.
Nearly identical percentage loss. The difference is that August had margin to absorb it and September didn’t.
Why summer hides it
Summer is the easiest season for a solar-only platform to look good. Days are long, the sun is high, and optimal production sits far above the load line — so far that direction, tilt, and placement can all be a little off and the platform never feels it. The setup seems forgiving because the margin is absorbing every mistake silently.
Heading into fall and winter, the margin itself is what disappears. Peak sun hours shrink and the sun sits lower, so optimal production slides down toward the load line — and every positioning loss that the summer margin used to swallow is suddenly the loss that crosses it. The platform that “proved itself” all summer was never being tested. The first real test arrives in late September, and by then the array has usually been aimed once and left untouched.
That’s why positioning should be planned against the hardest realistic month of the mission, not the best case. If deployment length matters, the unit should be evaluated under real-world conditions, including seasonality and setup limitations — not every trailer can be parked in the center of an empty lot with perfect sunlight.
Positioning Constraints Happen in the Field
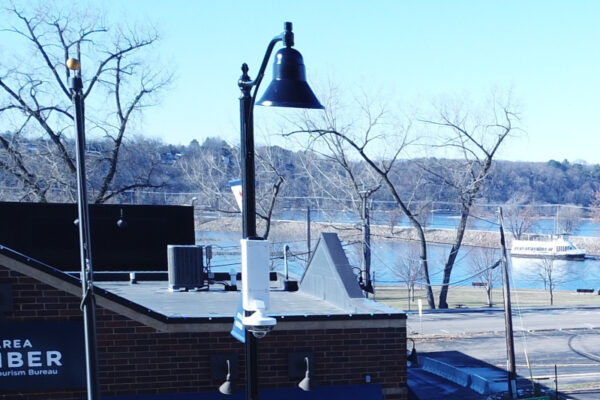
Positioning rarely fails because someone was careless. It comes down to operational decisions made under real constraints. The unit has to cover a particular spot: the entrance, the lot, or the equipment yard, the mission is actually about. That requirement, not solar exposure, usually decides where it parks.
Ordinary compromises get baked in. A platform is parked where access is convenient, rather than where the sun is strongest. The panels get aimed once and left untouched. The mast throws a moving shadow across the array. A box truck parks in the space next to the surveillance trailer. Trees that were bare at setup fill in. Individually, none of these looks like a failure. Together, a string of small deficit days draws the battery state of charge down with no single dramatic event to point to.
The losses are bigger than they look. Shade and panel angle are among the largest levers on how much energy a solar-only platform actually harvests, and every watt lost there comes straight out of battery recovery. A panel held at the wrong tilt, or clipped by a moving afternoon shadow, can give up a real share of its daily production while everything still appears to be working.
The easiest way to see it is to change the inputs yourself. Adjust the shading and panel angle below and watch how projected output responds.
See How Your setup affects your solar deployment timeline
Adjust panel direction, tilt, and location to see how each setup choice affects your projected days of solar-only uptime in the field.
Deployment Location
Field Deployment
What these results assume · 800 W solar · 460 Ah AGM · 100 W load
Every result models one fixed, solar-only reference platform. A day-by-day simulation starts each month with a full battery and steps through the real upcoming months until the pack is depleted — so a deployment is bounded by the leaner months it runs into, not just its launch month.
Solar data is PVGIS typical-meteorological-year (average clouds & rain included). ·
Enter a ZIP code and set your options on the left to see the results.
Where the loss comes from
Each lever's energy cost on its own — they stack up together into the figure above.
Monthly Energy Production
Why a Drop in Power Isn't an Equal Drop in Runtime
Trailer Runtime, by Start Month
How this is calculated
The 100% baseline
The most energy the array could collect at your location — ideally aimed (true south), at the best tilt for each month's sun, with no shade. Months are weighted by their real sunshine using the PVGIS Typical-Meteorological-Year grid, so brighter months count for more.
Your setup
A clear-sky plane-of-array model re-scores the array at the direction and tilt you picked, then applies a peak-hour shading factor. Because cells are wired in series, partial shade costs more than its area: light ≈ −8%, partial ≈ −28%, heavy ≈ −50%. The result is the percentage of the ideal energy you give up.
Why winter is worse
A low winter sun sits closer to due south for fewer hours, so the same aiming and tilt errors shave off a bigger share of the day's energy — which is why a summer tilt left on, or a shadow across the array, hurts most in the months you can least afford it.
Expected days in the field
The chart runs a day-by-day simulation for a reference platform — an 800 W array, a 460 Ah AGM bank (≈ 5.5 kWh usable at 50% depth-of-discharge), and a 100 W continuous load. Starting with a full battery in each month, it steps forward through the real upcoming months (daily charge minus load, battery capped at full) and counts the days until the pack is depleted — so a deployment launched in a strong month is still limited by the leaner months it runs into. A bar at 90+ rides into the next year. Green is optimal positioning, orange is your setup; the gap is what positioning costs you.
A planning estimate — real output also depends on weather, snow, soiling and mounting.
About the solar data
Where it comes from
The amount of sun at each location is from PVGIS — the European Commission Joint Research Centre's Typical Meteorological Year (TMY) dataset — on a 2° grid across the US (plus Alaska & Hawaii). Each point gives the average solar energy by month, in kWh per day per kW of panel, with standard system losses already applied. It's the same dataset behind our Solar Runtime Map.
Canada is covered too. Direct PVGIS data (from the North American NSRDB record) for the major Canadian regions and cities; the few most remote spots interpolate from the nearest points.
Does it include clouds and rain?
Yes. TMY is built from many years of real satellite and ground weather observations, so average cloud cover, haze and rain are already baked into the monthly numbers. That's why a cloudy region reads lower than a sunny one at the same latitude, and why every location dips in winter beyond just the shorter days — you're not seeing a clear-sky best case.
What it doesn't capture
TMY is a typical year, and the day counts use each month's average generation. So it reflects the normal climate of a place — not a specific forecast or a worst-case storm. A prolonged cloudy stretch will drain the battery faster than these averages show, so treat the days in the field as typical conditions, not a guarantee.
The positioning penalty
How much direction, tilt and shading cost you is computed from sun-angle geometry and applied on top of the weather-adjusted PVGIS baseline. Clouds affect a good and a bad setup equally, so they cancel out of the loss percentage and stay in the absolute kWh and days.
Why runtime falls off a cliff
Runtime follows the margin, not the production
Each day the battery gains the difference between what the panels produce and what the load consumes (2.4 kWh/day for this platform). As long as production covers the load, the battery never drains — the runtime is unlimited, no matter how much extra is produced.
Below the line, the battery is a countdown
The moment production falls under the load, the battery bridges the gap, and runtime becomes usable battery ÷ daily shortfall. A shortfall of just half a kWh per day empties this platform's 5.5 kWh bank in about 11 days.
That's the cliff
So a percentage decrease in power is not an equal decrease in runtime. Losing 30% of production in a month with plenty of margin costs nothing; losing the same 30% in a month where the margin is thin drops runtime from unlimited to days. What matters isn't how much power positioning loses — it's whether the loss pushes production across the load line.
About these options
Direction is which way the panel face points. Panels collect the most when they face the sun's midday arc — in North America that means true south.
Dead-on true south default
Aimed using the sun or GPS rather than a compass needle — the best case. It's the default because the results measure what a setup loses, so the baseline starts at perfect aim.
Aimed by compass
A magnetic compass points to magnetic south, which is off true south by your local magnetic declination — 10–20° in much of North America. This option uses the actual declination at your postal code, so its cost changes with location.
Eyeballed (±15°)
The trailer was parked "roughly facing south" with no instruments — modeled as 15° off true south, a typical eyeball error.
Tilt is the panel's angle up from flat. The best angle follows the sun's height through the year: steep in winter (low sun), shallow in summer (high sun).
Re-tilted each season default
A crew adjusts the array to each month's best angle as the season turns — the best-practice benchmark, and the default for the same reason as direction: the baseline starts at the discipline a well-run deployment can hold.
Fixed at latitude
The classic set-and-forget compromise. Your latitude is how many degrees north of the equator the site sits, and that same number works as a tilt angle: raise the panels that many degrees up from flat and they point at the sun's average height for the year. For example, Denver sits at about 40°N, so "fixed at latitude" there means panels tilted 40° up from flat. Decent in every season, ideal in none.
Summer angle left on
Set shallow for the high summer sun (≈ latitude − 15°) and never revisited — the most common way setups quietly drift out of spec. It keeps working into fall and winter, just at a fraction of what a re-tilted array would produce, exactly when daylight is shortest.
Near-flat
Panels nearly horizontal (about 5°) — an array that was never raised after parking. It misses most of the low winter sun and is the slowest to shed snow.
Shading is whatever crosses the array during the peak charging hours around midday. Because solar cells are wired in series, a shadow costs far more than the area it covers — a small dark stripe can knock out a whole panel section.
Clear exposure default
Open sky over the panels through the middle of the day. The default planning assumption — pick a shading level below if anything actually crosses your array.
Light — mast shadow (≈ −8%)
The platform's own mast or antenna sweeping a thin moving shadow across the panels.
Partial — pole / vehicle (≈ −28%)
A light pole, parked vehicle, or similar object shading part of the array during peak hours — the classic "parked where it was convenient" cost.
Heavy — structure / trees (≈ −50%)
A building or tree line blocking the panels for a large share of the charging window. Also worth remembering: shadows move with the season, and trees that were bare at setup fill in.
The pattern holds across scenarios. As shade increases or the angle drifts away from optimal, harvested energy falls, and the platform has less margin to carry it through the night and into the next day.
This is an operations question more than a technology one, and it’s why power architecture has to match the site. A solar-only platform is a strong fit when a team controls placement, keeps the array clean, watches conditions, and can re-tilt as the season turns. But some locations simply don’t offer ideal sun. They are shaded, far north, or running through a hard winter, and no amount of positioning discipline changes that. For those deployments, Mobile Pro Systems builds the Falcon with an optional power generator and the Commander as a true hybrid, so uptime doesn’t depend on the sun cooperating. When a site can’t guarantee the conditions solar needs, the platform shouldn’t have to either.
Conclusion
Solar-only uptime is not determined by the presence of solar panels alone. It is determined by whether the solar panel positioning gives those panels a fair chance to do their job every day.
That means setup is not a minor detail. It is part of the system.
Direction, tilt, shade, seasonality, site layout, camera load, communications load, and deployment length all shape whether a solar-only platform can recover enough energy to stay ahead of demand. When those factors are understood and managed, solar can be a strong, efficient power strategy. When they are ignored, the platform may still look fine — until the batteries stop recovering and uptime becomes a question at the exact moment coverage matters.
For teams evaluating mobile surveillance units, the right question is not simply, “Does it have solar?” The better question is, “Can this deployment sustain solar-only operation under the real conditions of the site?”
That is the difference between a spec-sheet answer and a field-ready answer.
Talk to Our Team About Reliable Off-Grid Surveillance
If you’re evaluating mobile surveillance trailers for remote, temporary, or long-duration deployments, our team can help you compare power architectures, deployment requirements, and operational tradeoffs. Speak with Mobile Pro Systems sales to see how the Commander 3400 supports dependable uptime in the field.
Questions to Ask Before You Buy
Reliable solar performance starts with the right engineering and the right deployment plan. Mobile Pro Systems trailers are designed for real-world uptime, not just ideal-condition estimates. As you evaluate providers, ask these questions of everyone you’re considering. And when you book a meeting with our team, we’ll walk through the details that matter: location, season, panel positioning, battery capacity, daily power draw, and the conditions your platform will actually face in the field.
What conditions are your runtime numbers based on?
A straight answer names a location, a season, a panel angle, and a power load. “All-day” or “continuous” with no conditions attached is a marketing number, not an engineering one.
What's the daily power draw of the exact configuration you're quoting?
What battery chemistry do you use, and what's the usable capacity versus the rated capacity?
AGM and other lead-acid banks are typically held to about half their rated amp-hours to preserve cycle life; lithium (LiFePO4) delivers more usable capacity and holds up better in the cold. The nameplate number alone can be misleading.
Can you show me location and season-specific production data, or only spec-sheet numbers?
Real solar data, broken out by region and month, is a sign a vendor is engineering to your site rather than to a brochure.
What depth of battery discharge does your runtime assume, and how does it affect battery life?
Aggressive discharge inflates the runtime figure while quietly shortening battery lifespan. The two numbers have to be read together.