
How Much Runtime Is Your Solar Positioning Giving Away?
Two identical surveillance trailers. Same panels, same battery, same site. One runs 90+ days on solar alone. The other quits in a week.
The hardware didn’t change. The setup did.
This calculator shows you the gap for your actual location. Enter a ZIP or Canadian postal code, set how the array is really aimed, tilted, and shaded. See how much energy the setup gives up against an ideal install, and how many days of field deployment that costs, month by month.
Deployment Location
Field Deployment
What these results assume · 800 W solar · 460 Ah AGM · 100 W load
Every result models one fixed, solar-only reference platform. A day-by-day simulation starts each month with a full battery and steps through the real upcoming months until the pack is depleted — so a deployment is bounded by the leaner months it runs into, not just its launch month.
Solar data is PVGIS typical-meteorological-year (average clouds & rain included). ·
Enter a ZIP code and set your options on the left to see the results.
Where the loss comes from
Each lever's energy cost on its own — they stack up together into the figure above.
Monthly Energy Production
Why a Drop in Power Isn't an Equal Drop in Runtime
Trailer Runtime, by Start Month
How this is calculated
The 100% baseline
The most energy the array could collect at your location — ideally aimed (true south), at the best tilt for each month's sun, with no shade. Months are weighted by their real sunshine using the PVGIS Typical-Meteorological-Year grid, so brighter months count for more.
Your setup
A clear-sky plane-of-array model re-scores the array at the direction and tilt you picked, then applies a peak-hour shading factor. Because cells are wired in series, partial shade costs more than its area: light ≈ −8%, partial ≈ −28%, heavy ≈ −50%. The result is the percentage of the ideal energy you give up.
Why winter is worse
A low winter sun sits closer to due south for fewer hours, so the same aiming and tilt errors shave off a bigger share of the day's energy — which is why a summer tilt left on, or a shadow across the array, hurts most in the months you can least afford it.
Expected days in the field
The chart runs a day-by-day simulation for a reference platform — an 800 W array, a 460 Ah AGM bank (≈ 5.5 kWh usable at 50% depth-of-discharge), and a 100 W continuous load. Starting with a full battery in each month, it steps forward through the real upcoming months (daily charge minus load, battery capped at full) and counts the days until the pack is depleted — so a deployment launched in a strong month is still limited by the leaner months it runs into. A bar at 90+ rides into the next year. Green is optimal positioning, orange is your setup; the gap is what positioning costs you.
A planning estimate — real output also depends on weather, snow, soiling and mounting.
About the solar data
Where it comes from
The amount of sun at each location is from PVGIS — the European Commission Joint Research Centre's Typical Meteorological Year (TMY) dataset — on a 2° grid across the US (plus Alaska & Hawaii). Each point gives the average solar energy by month, in kWh per day per kW of panel, with standard system losses already applied. It's the same dataset behind our Solar Runtime Map.
Canada is covered too. Direct PVGIS data (from the North American NSRDB record) for the major Canadian regions and cities; the few most remote spots interpolate from the nearest points.
Does it include clouds and rain?
Yes. TMY is built from many years of real satellite and ground weather observations, so average cloud cover, haze and rain are already baked into the monthly numbers. That's why a cloudy region reads lower than a sunny one at the same latitude, and why every location dips in winter beyond just the shorter days — you're not seeing a clear-sky best case.
What it doesn't capture
TMY is a typical year, and the day counts use each month's average generation. So it reflects the normal climate of a place — not a specific forecast or a worst-case storm. A prolonged cloudy stretch will drain the battery faster than these averages show, so treat the days in the field as typical conditions, not a guarantee.
The positioning penalty
How much direction, tilt and shading cost you is computed from sun-angle geometry and applied on top of the weather-adjusted PVGIS baseline. Clouds affect a good and a bad setup equally, so they cancel out of the loss percentage and stay in the absolute kWh and days.
Why runtime falls off a cliff
Runtime follows the margin, not the production
Each day the battery gains the difference between what the panels produce and what the load consumes (2.4 kWh/day for this platform). As long as production covers the load, the battery never drains — the runtime is unlimited, no matter how much extra is produced.
Below the line, the battery is a countdown
The moment production falls under the load, the battery bridges the gap, and runtime becomes usable battery ÷ daily shortfall. A shortfall of just half a kWh per day empties this platform's 5.5 kWh bank in about 11 days.
That's the cliff
So a percentage decrease in power is not an equal decrease in runtime. Losing 30% of production in a month with plenty of margin costs nothing; losing the same 30% in a month where the margin is thin drops runtime from unlimited to days. What matters isn't how much power positioning loses — it's whether the loss pushes production across the load line.
About these options
Direction is which way the panel face points. Panels collect the most when they face the sun's midday arc — in North America that means true south.
Dead-on true south default
Aimed using the sun or GPS rather than a compass needle — the best case. It's the default because the results measure what a setup loses, so the baseline starts at perfect aim.
Aimed by compass
A magnetic compass points to magnetic south, which is off true south by your local magnetic declination — 10–20° in much of North America. This option uses the actual declination at your postal code, so its cost changes with location.
Eyeballed (±15°)
The trailer was parked "roughly facing south" with no instruments — modeled as 15° off true south, a typical eyeball error.
Tilt is the panel's angle up from flat. The best angle follows the sun's height through the year: steep in winter (low sun), shallow in summer (high sun).
Re-tilted each season default
A crew adjusts the array to each month's best angle as the season turns — the best-practice benchmark, and the default for the same reason as direction: the baseline starts at the discipline a well-run deployment can hold.
Fixed at latitude
The classic set-and-forget compromise. Your latitude is how many degrees north of the equator the site sits, and that same number works as a tilt angle: raise the panels that many degrees up from flat and they point at the sun's average height for the year. For example, Denver sits at about 40°N, so "fixed at latitude" there means panels tilted 40° up from flat. Decent in every season, ideal in none.
Summer angle left on
Set shallow for the high summer sun (≈ latitude − 15°) and never revisited — the most common way setups quietly drift out of spec. It keeps working into fall and winter, just at a fraction of what a re-tilted array would produce, exactly when daylight is shortest.
Near-flat
Panels nearly horizontal (about 5°) — an array that was never raised after parking. It misses most of the low winter sun and is the slowest to shed snow.
Shading is whatever crosses the array during the peak charging hours around midday. Because solar cells are wired in series, a shadow costs far more than the area it covers — a small dark stripe can knock out a whole panel section.
Clear exposure default
Open sky over the panels through the middle of the day. The default planning assumption — pick a shading level below if anything actually crosses your array.
Light — mast shadow (≈ −8%)
The platform's own mast or antenna sweeping a thin moving shadow across the panels.
Partial — pole / vehicle (≈ −28%)
A light pole, parked vehicle, or similar object shading part of the array during peak hours — the classic "parked where it was convenient" cost.
Heavy — structure / trees (≈ −50%)
A building or tree line blocking the panels for a large share of the charging window. Also worth remembering: shadows move with the season, and trees that were bare at setup fill in.
Now You've Seen the Math
Let's Build the Plan for Your Deployment
Panel count sets the ceiling.
Positioning decides what you actually get.
Spec sheets describe a perfect install: aimed dead-on true south, tilted for the season, nothing shading the array. Real sites are rarely that kind. The trailer gets parked where the gate is, the panels get eyeballed toward “south-ish,” and a light pole throws a shadow across the array every afternoon.
Four field variables determine how close a deployment gets to its ceiling:
1) Direction: “South” by compass isn’t true south — magnetic declination can put you 15° off in places like Seattle. The calculator uses NOAA’s World Magnetic Model to compute your local error.
2) Tilt: A summer angle left on into November, or panels laid near-flat, quietly cuts winter harvest when you can least afford it.
3) Shading: The most underestimated lever. Solar cells are wired in series, so a shadow across part of the array costs far more than the shaded area suggests — in typical degraded setups, shading alone drives most of the loss.
4) Season: Summer performance hides winter risk. A setup that recovers easily in June can quietly drain in November with nothing about the hardware changed.
Built on real weather data
Solar resource: PVGIS Typical Meteorological Year data from the European Commission Joint Research Centre — built from years of real satellite and ground observations, so clouds and rain are already in the numbers. Coverage spans the US (including Alaska and Hawaii) plus Canada.
Positioning penalty: a plane-of-array model scores your tilt and aim against the per-month ideal for your latitude.
Compass error: computed from your actual local magnetic declination (NOAA WMM2025).
Reference platform: every result models one fixed solar-only setup so comparisons stay honest (800 W array, 460 Ah AGM battery (~5.5 kWh usable), and a 100 W continuous load).
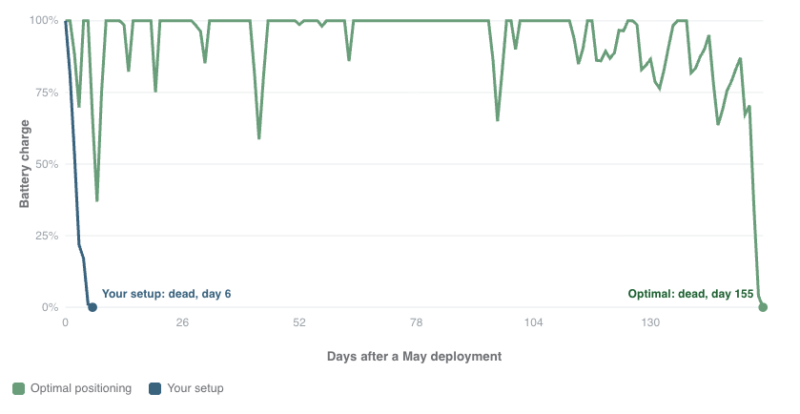
Not just a percentage — days in the field
Energy loss is abstract. Days are not. For every start month, the calculator runs a day-by-day simulation: full battery on day one, then charge minus load through the *actual upcoming months* until the pack is depleted. A September launch is bounded by the lean October and November it runs into — not just September’s sun.
You’ll see:
- An annual energy loss versus an ideally positioned, unshaded array — and your worst month
- Where the loss comes from: direction, tilt, and shading, each scored separately
- Expected days in the field for every start month — optimal setup vs. yours